
PhaseStride Gantt
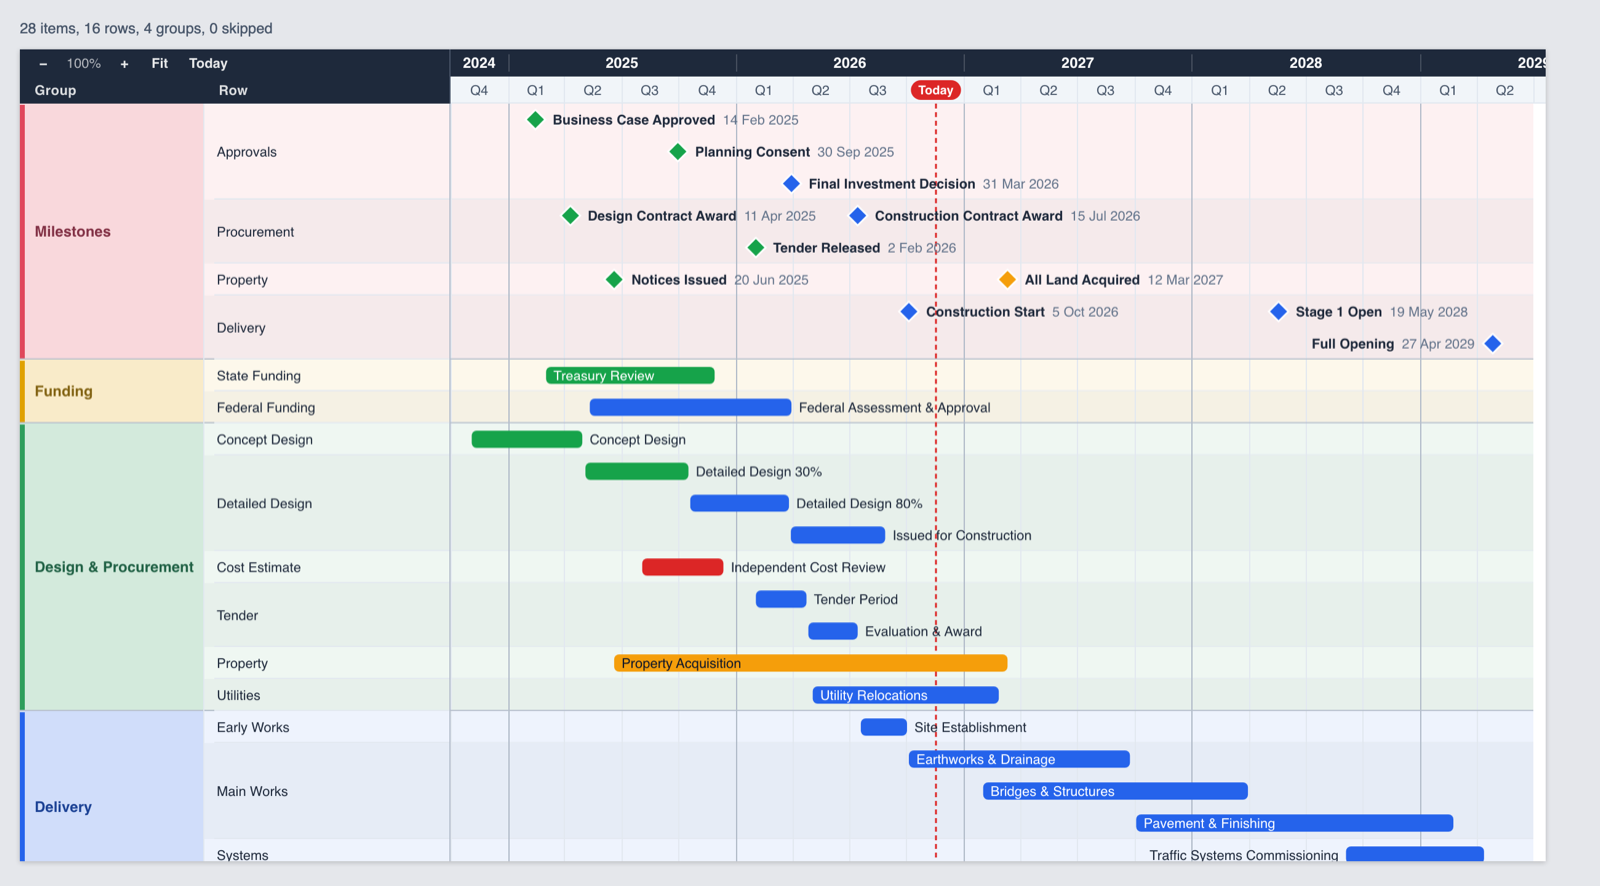
A Gantt and milestone visual for Microsoft Power BI. Built for real programme schedules: hundreds of activities, crowded milestones and executives who need to read it at a glance.
Measured in our automated test harness on Apple silicon. Times in Power BI depend on your machine and report.
Readable schedules, without the tidying up
Drop in your dates and names. PhaseStride Gantt handles the layout.
Collision-free labels
Milestone and bar labels are placed in lanes so they never overlap. Long names shorten or hide gracefully, and text colour adjusts for contrast.
Hierarchy your way
Group, subgroup and row levels in a table or an indented tree. Collapse a group to see a rolled-up summary bar with readable labels.
Zoom and fit
Zoom in to weeks or out to years. Fit-to-screen includes the labels, so nothing is cut off at the edges.
Fiscal years and today
Show calendar or fiscal years and quarters, with a today line that keeps everyone on the same date.
Native Power BI behaviour
Click to select and cross-filter, respond to slicers, use the context menu and tooltips, and support high-contrast mode.
Works with messy data
Recognises common date formats, including Primavera P6 text dates, Excel serial dates and Power BI date hierarchies.
Stays fast when the schedule gets big
PhaseStride Gantt only draws what is on screen. Scrolling, zooming and expanding stay responsive up to the 30,000 rows Power BI passes to a visual.
- Zooming 20,000 items takes about 26 ms in our tests
- Expand all and collapse all in well under a tenth of a second
- Performance budgets checked automatically on every build
Your data stays in your report
The visual has no network access, no tracking and no watermark on free features. It runs entirely inside Power BI.
- No external services, scripts or fonts
- Zero known vulnerabilities in dependencies at release
- Designed against Microsoft's certification requirements
What is available, and what is coming
Beta feedback decides the order of the next items.
| Capability | Status |
|---|---|
| Group → Subgroup → Row hierarchy, table or tree layout, expand and collapse with rolled-up summaries | Available |
| Collision-free labels, auto-contrast text, fit-to-screen including labels | Available |
| Zoom, today line, fiscal years, status colours | Available |
| Power BI selection, cross-filtering, context menu, tooltips, high contrast | Available |
| Virtualised rendering for schedules up to Power BI's 30,000-row data window | Available |
| Unlimited WBS levels from ID and Parent ID columns | Next |
| Configurable columns from fields and measures | Next |
| Keyboard navigation and saved collapse / zoom state | Next |
| Progress, baselines and schedule variance | Planned |
| Dependencies and critical path | Planned |
Four fields to a working Gantt
1. Import
Import the .pbiviz file into Power BI Desktop: Visualizations → … → Import a visual from a file.
2. Add fields
Drag in Item name, Start and End dates. Add Group, Subgroup and Row for hierarchy.
3. Colour it
Add a Status or Type field to colour bars and milestones automatically.
4. Format
Choose table or tree layout, fiscal year start, label style and colours in the Format pane.
Try it with your own schedule
Beta testers get the visual, sample data, scenario guides and a direct line to the people building it.